
Class Page for CE 413 - Fall 2018
![]()
![]()
![]()
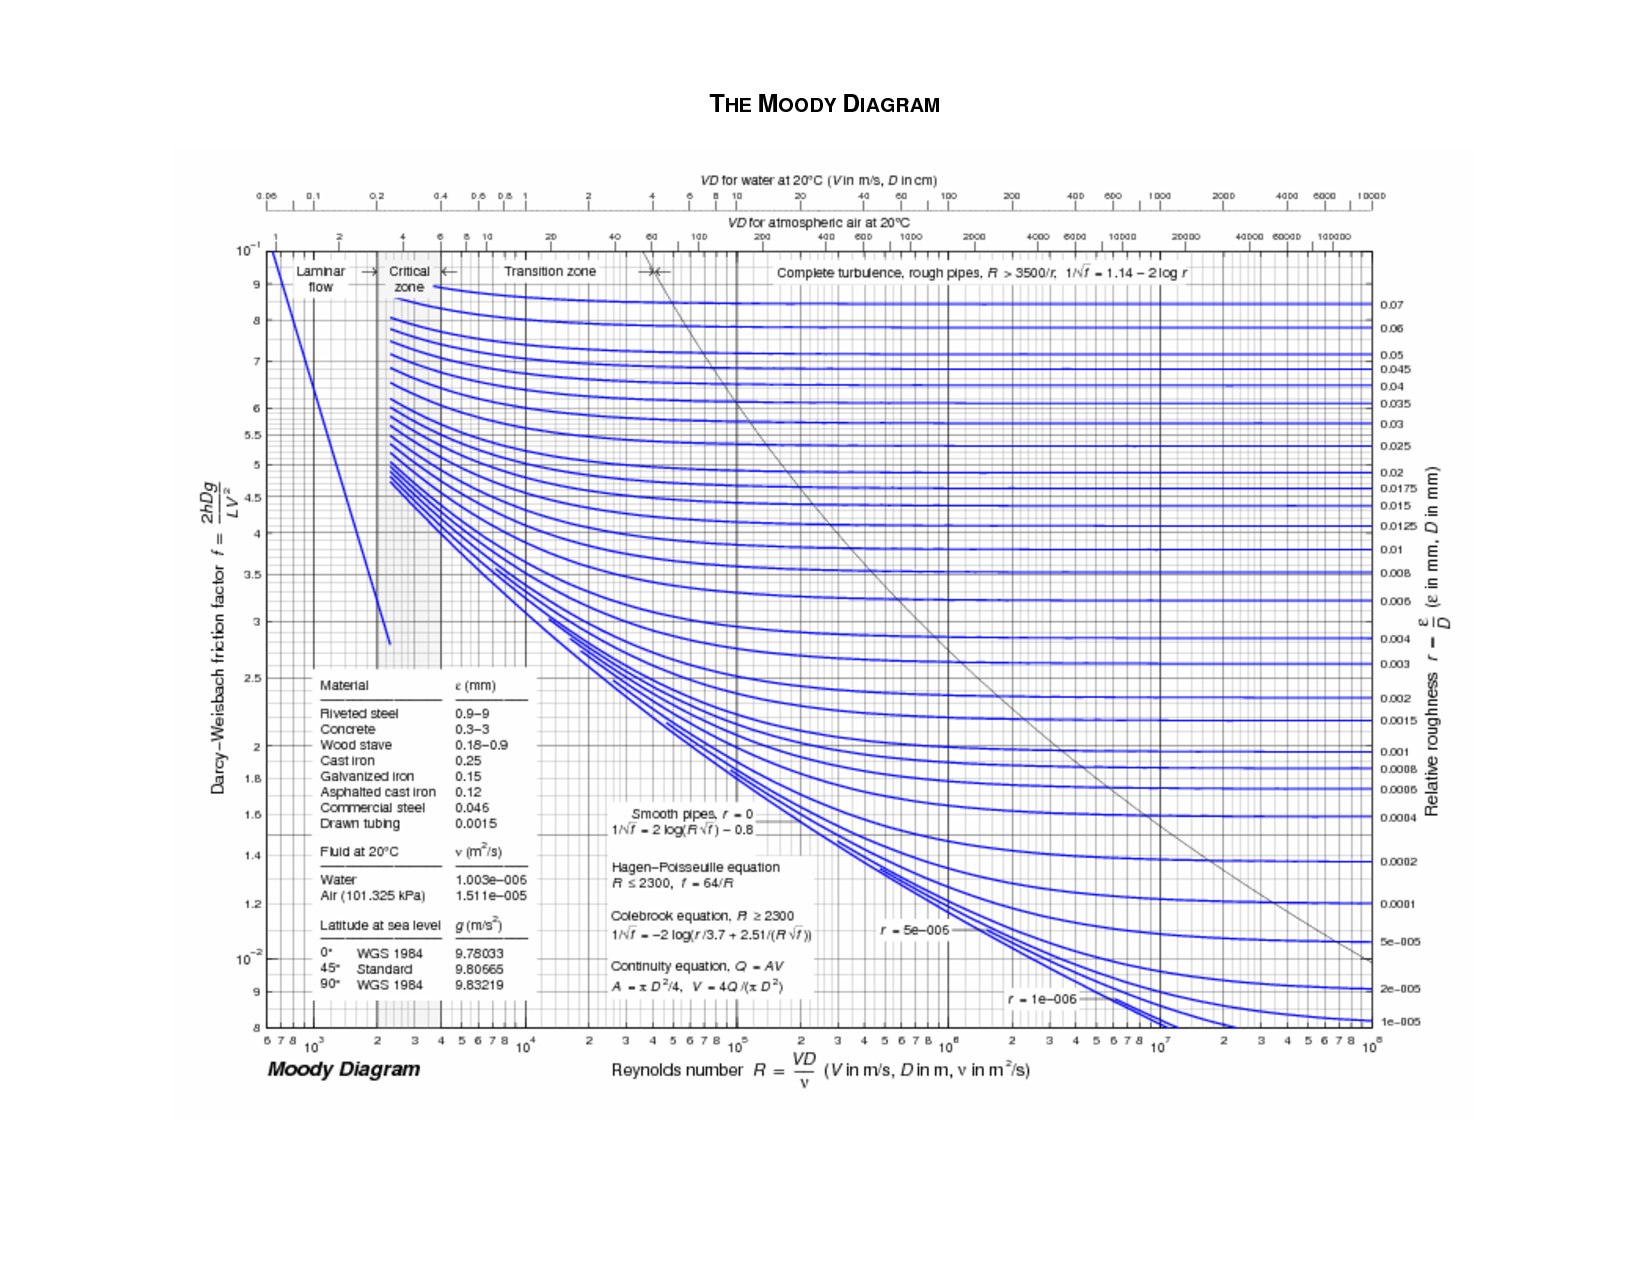
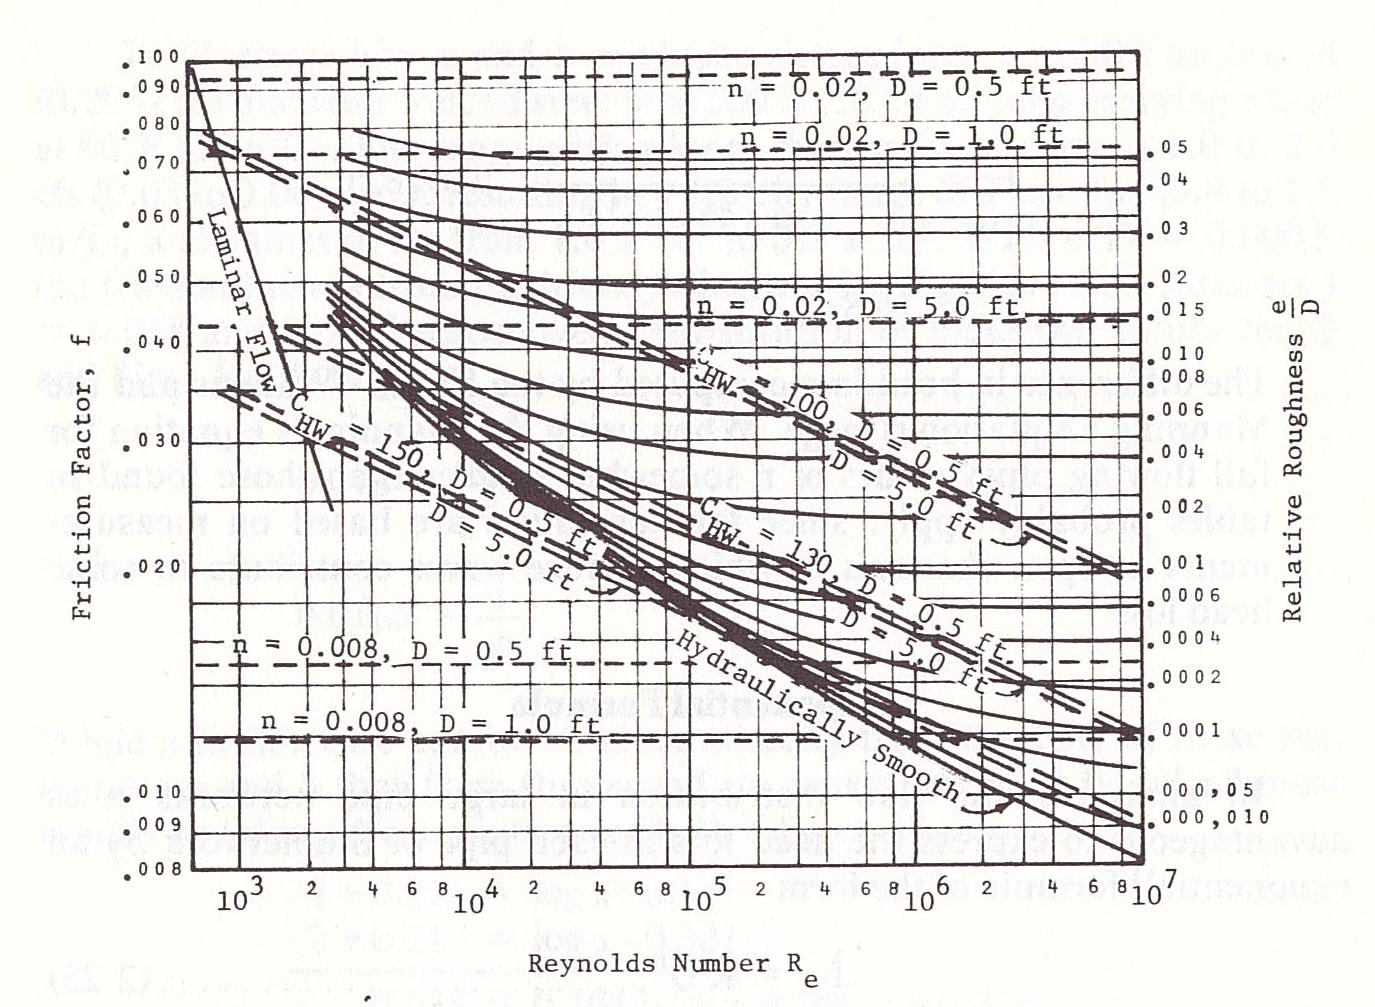
![]() View Empirical Flow Eqs. on Moody Diagram
View Empirical Flow Eqs. on Moody Diagram
![]()
![]() Sanitary Sewer Flow Estimation
by Specific Sources
Sanitary Sewer Flow Estimation
by Specific Sources
![]()
![]() Average I/I and Peak Flows as a
Function of Service Area or Average Flow
Average I/I and Peak Flows as a
Function of Service Area or Average Flow
![]()
![]()
![]()
![]() Figures and Tables for Hydrology
Figures and Tables for Hydrology
![]()
![]()
![]()
![]() Detention and Retention Impoundments Reading
Detention and Retention Impoundments Reading
![]() Urban Hydrology and BMPs Reading
Urban Hydrology and BMPs Reading
![]()
![]()
![]()
![]()
![]()
![]()
![]()
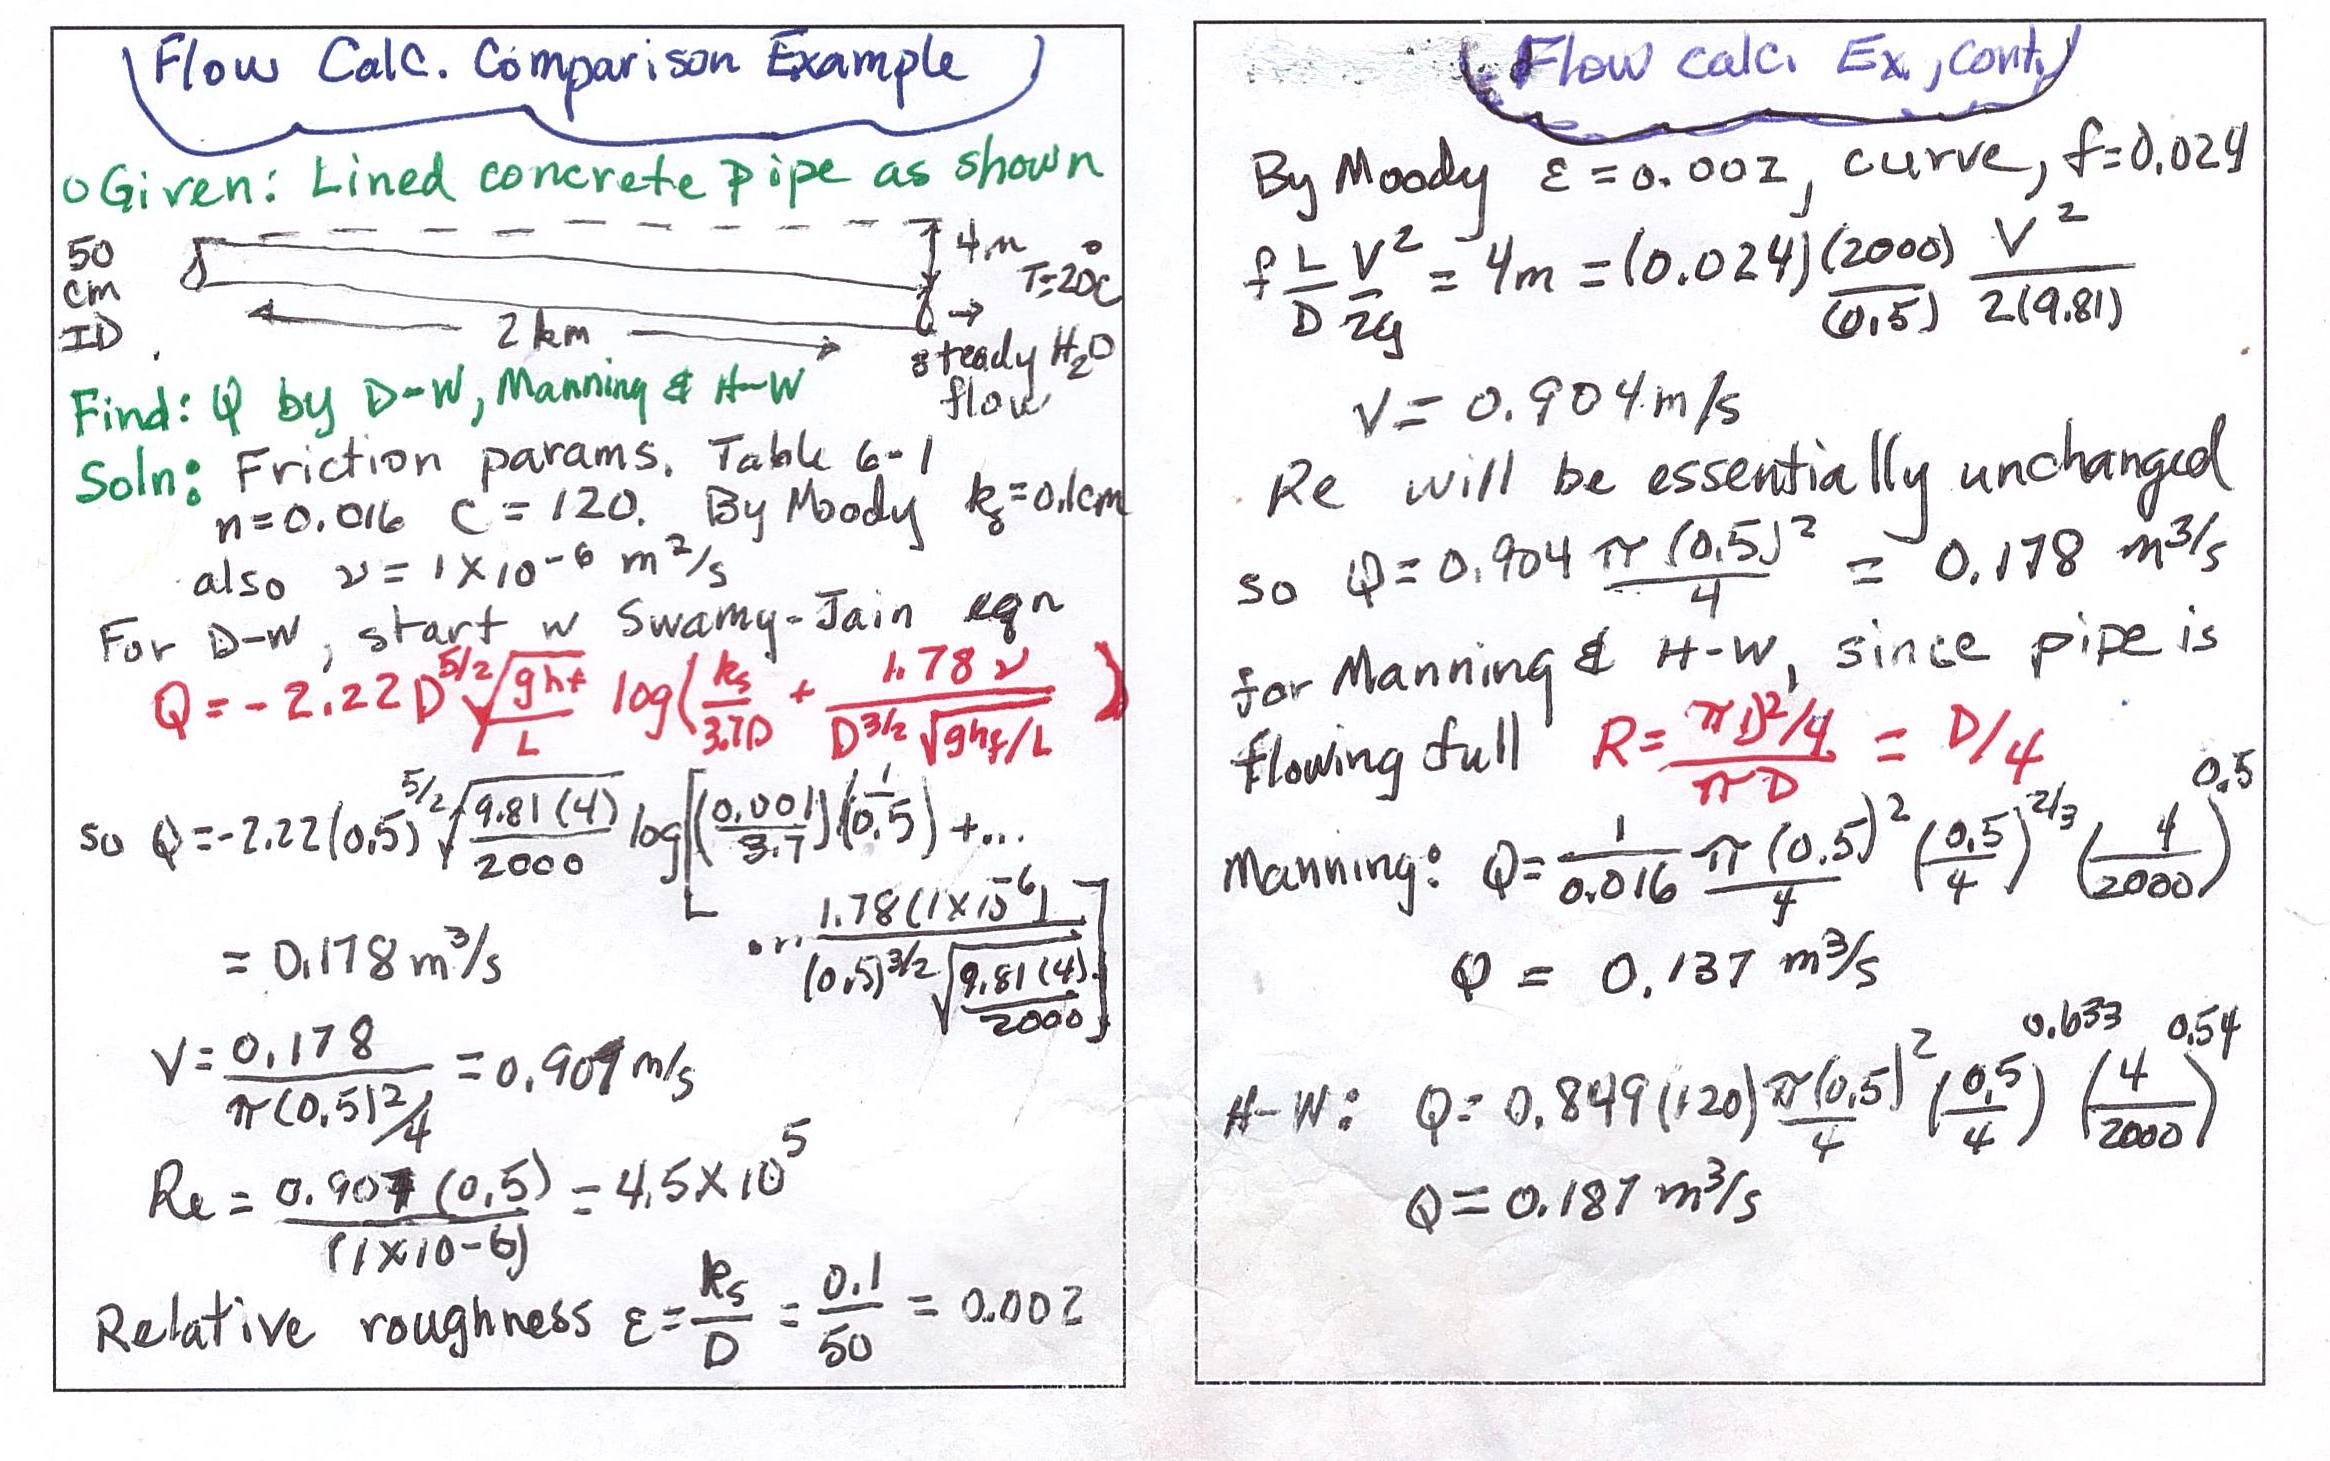
![]() Reworked Boardnotes - Q Calculation Example
Reworked Boardnotes - Q Calculation Example
![]()
![]() Spreadsheet for Fixed Point Pipe Normal Flow Example
Spreadsheet for Fixed Point Pipe Normal Flow Example
![]()
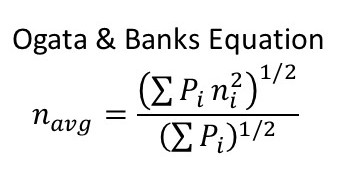
![]() Corrected Average Roughness Equation
Corrected Average Roughness Equation
![]()
![]() Text Min Slope Table to Function
Text Min Slope Table to Function
![]()
![]() Table 7.3 and 7.4 Calculation Spreadsheets
Table 7.3 and 7.4 Calculation Spreadsheets
![]()
![]()
![]() PDF of Spreasheet for Text Ex. 7-11
(Hydraulic Routing)
PDF of Spreasheet for Text Ex. 7-11
(Hydraulic Routing)
